Reservoir Data
Please click on each state link, to view reservoir data.
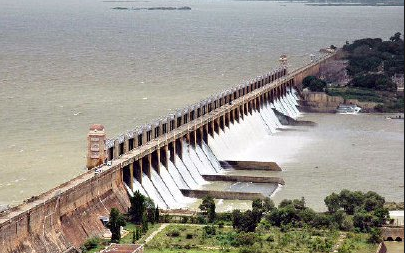
Karnataka
Karnataka Reservoirs Num : 48
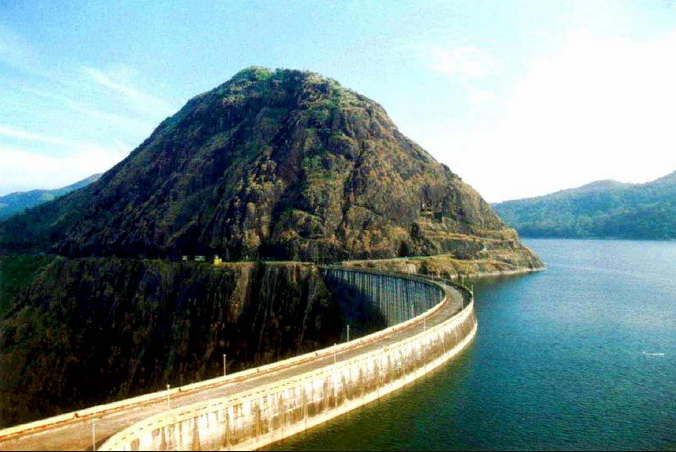
Kerala
Kerala Reservoirs Num : 36
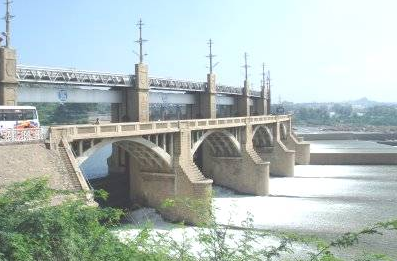
Tamil Nadu
Tamil Nadu Reservoirs Num : 71
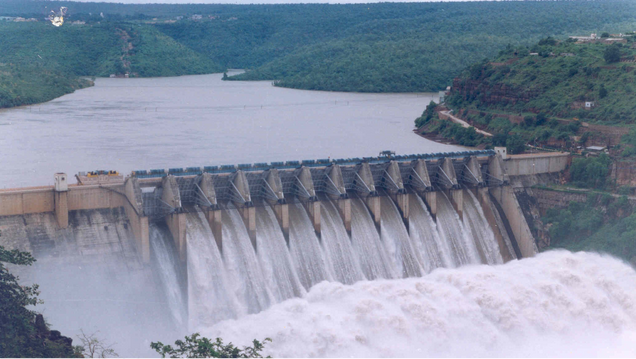
Andhra Pradesh
Andhra Pradesh Reservoirs Num : 22
Telangana
Telangana Reservoirs Num : 21
Maharashtra
Maharashtra Reservoirs Num : 70